In this post I will reveal some of our secrets as to how we use Artificial Intelligence, by means of machine learning, to pretty accurately predict the price of Bitcoin in the short-term. Since we refer to short-term as up to two hours, we are able to make pretty accurate trend predictions. However, the further into the future we try to predict, the less accurate results we obtain. Since the crypto space is very volatile and highly unpredictable, short-term forecasting remains our most realistic approach.
In my previous post I’ve explained and addressed some of our shortcomings. As of today, I will no longer use aggregated average prices from various exchanges, but instead use realistic price data from one specific exchange, and if any back testing is carried out then it will always incorporate the trading fees — unless explicitly mentioned otherwise.
The goal
We
know for a fact that some investing firms invest heavily in R&D to develop A.I. based trading algorithms and models. And we also know that they are making a profit by doing that, otherwise they wouldn’t be doing it. This also means that smaller organizations (like ours) can do that as well, but on a smaller and more controlled scale.
We have been developing machine learning systems to forecast cryptocurrency prices and trends for a couple of months now. The results of our efforts, as you can read in previous posts, have been eye opening already. But since recently we took it one step further and improved our systems, as you’ll read below.
Short-term Bitcoin predictions
B
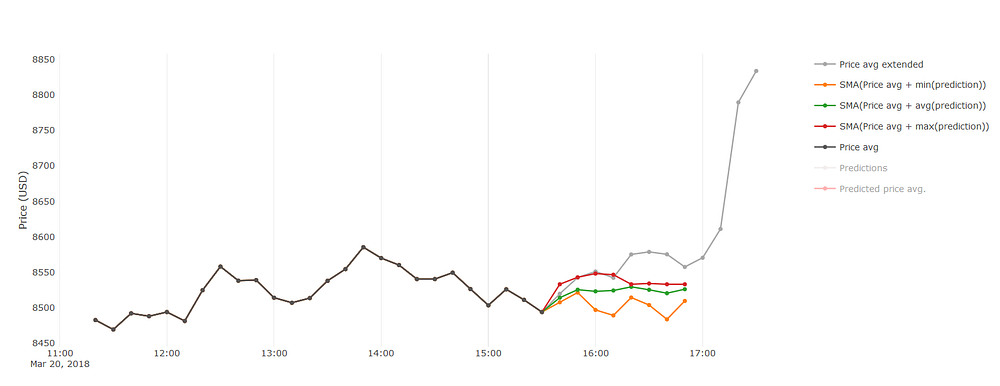
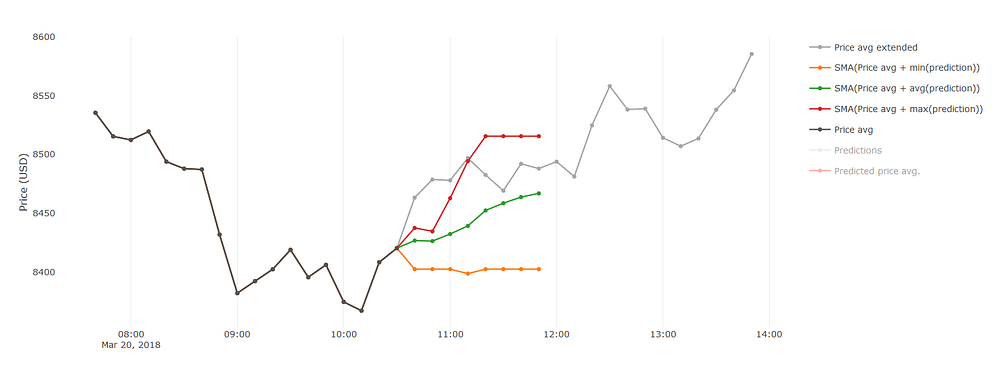
elow are two screenshots that illustrate our current prediction results. On these charts, the dark black line is the historic price; the gray line is the actual future price, we know this future price because I’m looking at results that were generated two hours ago. The red/green/orange lines are a summary of the predictions. Since we generate a multitude of predictions, we only want to see a handful of them, so we only show the most optimistic, pessimistic and the average prediction.
Both of these charts depict predictions of the price for 8 intervals into the future, with each interval being 10 minutes. So that is 1h20m (80minutes) into the future:
It’s important to remember that the absolute value of these predictions don’t matter as much as their general trend. These predictions are generated by a complex mathematical model, so their absolute value may deviate from reality. However, we instead use these as a tool to forecast whether the price will go up, down or stay as is. And coming back to our initial remarks, the reason why the absolute value of the predictions are of even lesser importance is that the prices are aggregated averages from all major exchanges — the predictions are not targeting one specific exchange.
On a side note — I’ve often been asked by readers if the predictions are over fitted, the answer is they are not. Our neural network systems are initially trained on a large data set, and from then on it uses data from the previous intervals (e.g. past 10 minutes) to re-train the neural network and make these predictions for the next 8 intervals. So we never generate predictions over a date range that has already been used for training, otherwise that would no longer be considered as “forecasting”.
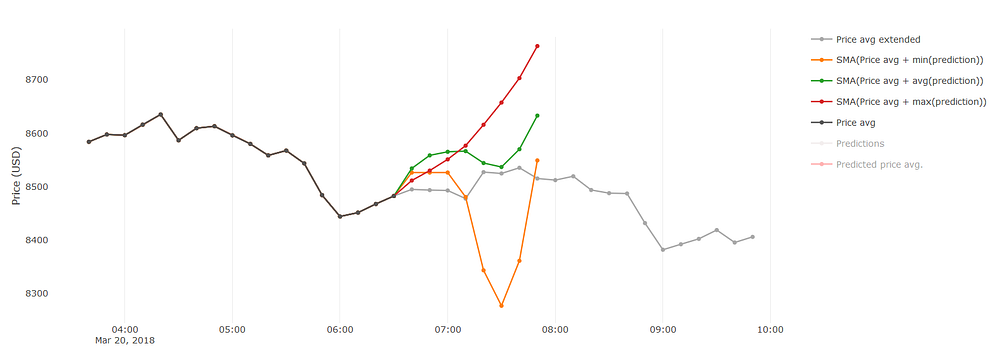
From the two screenshots above, the predictions appear to be pretty accurate, and in many cases they are. But in some cases they are not. Have a look at the next chart where the predictions deviate immensely. The optimistic prediction shows the price going up exponentially, the average one looks more sinusoidal and the pessimistic prediction indicates a huge drop with a strong recovery afterwards. These predictions look very anomalic to us humans, but for the system they are no different, so to improve or filter them out we need to understand better how A.I. works. Unless we fully understand why it makes such predictions, we cannot improve them — and learning how A.I. makes decisions requires yet another A.I. component to do just that, this remains work in progress.
Realistic Bitcoin predictions
As
briefly mentioned previously, we no longer use aggregated average price data. Instead we shall focus on one (or multiple) crypto exchanges. At this stage we solely use the Binance exchange for our purposes, we are not affiliated with that company in any way.
About a week ago I started using one-minute candlesticks as input data for our neural network. Initially it yielded no meaningful results, after struggling for two whole days trying to tweak a whole bunch of parameters, I just put it aside and focused on different parts of our project.
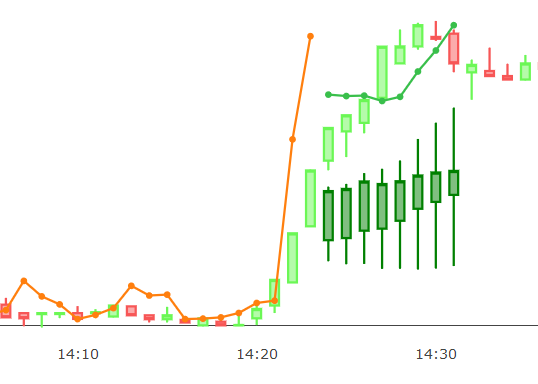
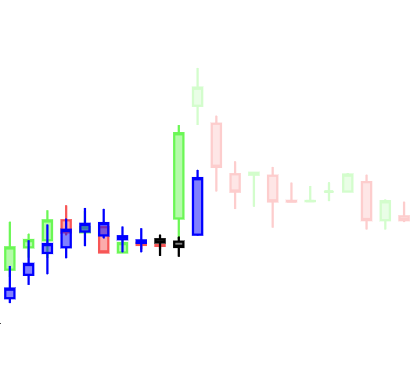
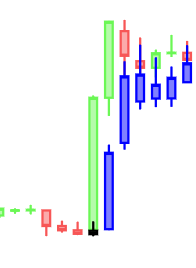
But then I realized that I was trying to solve a problem using an old mindset. The old mindset is to make eight predictions, which yielded pretty “okay” results on the aggregated price data, but not necessarily on the Binance data using 1 minute candlesticks. So I had to redesign this little detail, and instead of making 8 predictions, I made it predict just one. I then also realized that having just one prediction will be a visual disaster, it tells us very little (from a visual perspective), because we’ll only see just one dot. To cope with this, I also made sure the system includes previously made predictions, now we can actually have a graph (a solid line, with multiple dots); this is something we can analyze and benchmark against the actual price. This new method for visualizing predictions looks like on the image below.
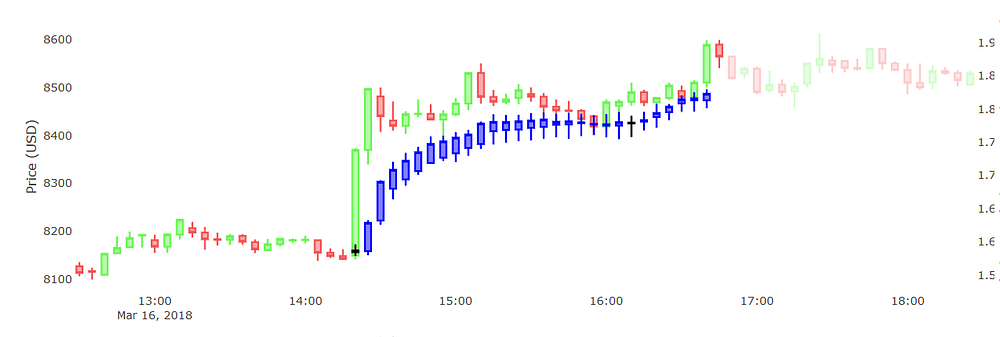
On the image there are two actual prices, the solid green/red candlesticks which are the historic prices (these were used as input for the neural net), while the slightly faded (lowered opacity) green/red candlesticks are the future price — this screenshot was taken at some historic time where the future price is already known so these candlesticks are present (with their opacity lowered). The blue/black candlesticks are the predictions made for their respective interval, given only the data prior to that interval. So in this example the last big “blue” candlestick is the result of the previous large green “candlestick”. The A.I. system has learned that the previous interval had a huge increase in price, so it predicts that the next interval will be an increase as well (compared to the previous prediction).
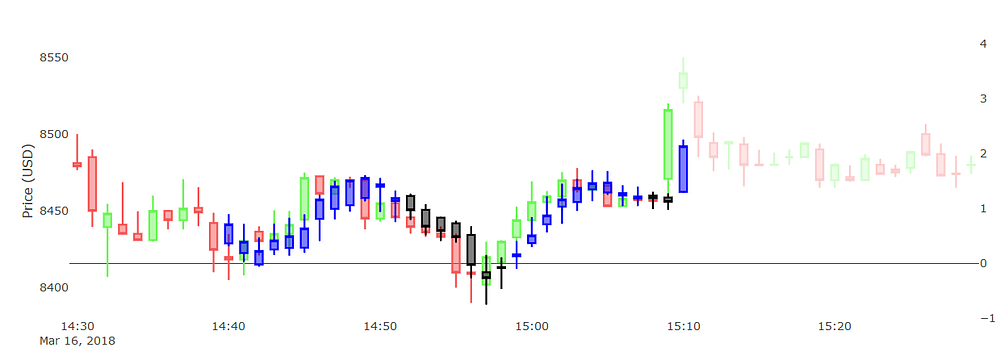
It actually depends on how we look at it and phrase it, some people may say that the price is about to go down if we use absolute values — while if we use the predictions as trends then it tell us the price is going to increase. Which of these two views/theories is most correct remains to be tested (i.e. back testing), there’s actually no trivial answer to this question. So for now it will be a combination of both looking at the trend and at the absolute values. Here’s a more complete image of the above:
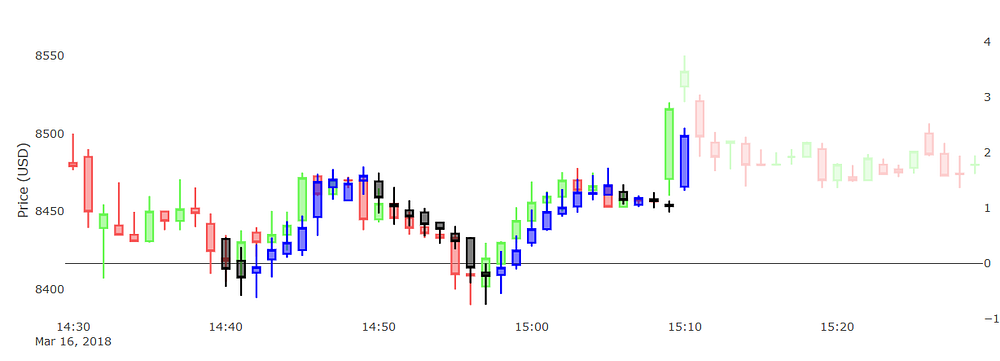
We clearly see how pretty accurate the trend of the predictions were compared to that of the price. This is what opened my eyes and allowed me to continue my research much deeper. Below is another screenshot generated in the same fashion, same data, but vastly different parameters and neural network structure:
We see that its results/predictions are quite similar to the first one. I actually like this one better (on first sight), because it has more “black” candlesticks (i.e. the close price was lower than open price). This one also looks slightly more over fitted, because its values appear to be closer in absolute terms. But as mentioned earlier, these prediction regions were not used as input to train the neural net so they are not directly biased,they are simply more accurate predictions in absolute terms — taking this statement into consideration, it’s amazing how well the system makes these one-interval predictions.
You may also have noticed that the system is not able to predict huge increases/drops in price, such as that big “green” candlestick, there is no way the system could predict that. And these increases are usually due to market manipulation (e.g. insider trading) or a group of people deciding to to buy loads of BTC during that interval — unless we have access to these groups, we cannot develop a system that forecasts these scenarios. But we do see that our system learns and adapts from these anomalies, it learns that after a huge increase (or decrease) comes either stability, even more growth or a sudden drop.
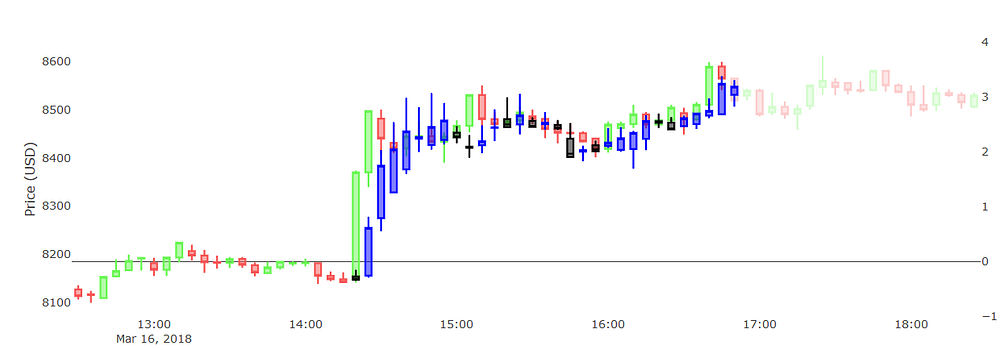
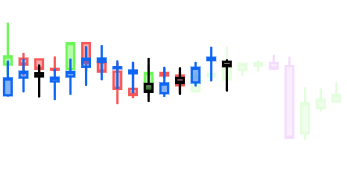
Having done this, I moved to the next level, increasing the interval size. So instead of predicting 1 minute ahead, let us use 5-minute interval candlesticks and predict 5 minutes ahead (which is still a single interval prediction in this case). Below are two screenshots with predictions generated by different neural nets for the same period:
From the two above predictions we see that the first one looks smoother, but also somewhat less accurate. The second one resembles the reality slightly better. Then again, notice how inaccurate it is for detecting anomalies, as described earlier:
Given the historical data, there is no indicator, i.e. there is no way the system can know the price will shoot up extremely fast/high (relative to the previous values), as shown on the above. So the prediction for the larger “green” candlestick is a tiny “black” candlestick indicating the price will be relatively stable, but instead it went up (a lot). Once again this proves our point, it’s practically not possible to predict such a scenario given our data — but fortunately the system is “learning” and can indicate what will happen after the price goes up as it did, we then can use these predictions to decide whether to buy/sell/hold.
Below is another example of 5-min interval predictions, this time I used yet another set of parameters and data set size. Notice how the shape/trend of these predictions differs from the previous ones.
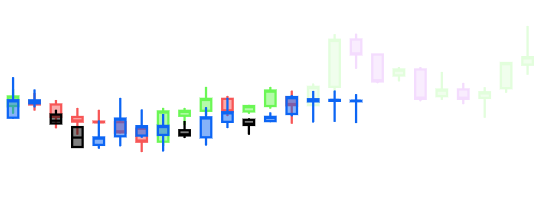
If we can make pretty “okay” predictions with 5-min candlesticks, why not with 10-min ones? That’s why I did next to see how accurate these would be, and here is one of those results:
We clearly see that the 10-min predictions are slightly less accurate compared to the 5-min ones, the major trend is still there — but it’s still unable to predict huge rises/drops as explained before. I did not go any further to predicting 20, 30, 60, … minute intervals simply because I shifted my focus to a next important matter.
Remember that I started of this chapter by explaining how I went from making 8-step predictions to just single step ones? That decision was not backed my experiments, there was actually nothing less accurate from the 8-steps compared to the 1-steps, that is if we only look at the very first prediction. But the confusing part was the other 7 predictions, since these usually deviate a lot from the actual future, and it made the results appear very inaccurate. The thing is, every new prediction has even lesser precision than the previous one. This I realized when I went from single step predictions to three step ones:
I realized that making 3-step ahead predictions appeared to be pretty accurate, more accurate than 8-step predictions to say the least. But then again, it wasn’t always the case:
Making multi-step predictions is done by using, in our system at least, the previously made prediction as the new input. And if the previous prediction wasn’t accurate then the next one won’t be either (in most of the cases). The reason behind this is that every prediction has an error percentage%, this error value grows exponentially at each new prediction step.
A deeper neural networks
It’s generally true that the depth/size of a neural network can improve (or degrade) the results. Until now I have always been using pretty shallow neural networks with just one or two hidden layers, and a handful of neurons per layer. But what would the results be like if I used a deeper neural network, for instance three to six hidden layers? I am not going to go very deep into deeper neural networks (DNNs), simply because the results are too “deep” to understand at this point. However I would like to share some cool findings. In the next few examples I trained DNNs and let it predict 16-step intervals, in the hope of finding something interesting.
Most results from our DNNs look way smoother than those from shallow NNs. But I also noticed that sometimes these DNNs produce very surprising and unexpected results. On the chart above we see how the system predicts a drop in price midway 17:00. Even though such as thing did not occur reality, it was still a fascinating anomaly.
Here’s another set of predictions, where at some point the system predicts the price to go up steadily in linear fashion, but then shortly before 17:00 it indicates a drop. If we compare this against how the price evolved in reality, we see something quite similar happening. The price did rise steadily until like 16:40 and then it dropped until 17:15 before going up again for a short period. In some way this can be seen in the predictions, but whether it’s the true meaning of these predictions is up for debate.
In the above it appears the system is anticipating for a huge drop midway 18:00 to 19:00. In reality no drop occurred in that range, except at 18:55.
I followed the previous prediction, and a few steps later it still kept anticipating for this huge drop. But now this drop has shifted closer to 19:00. And in reality there was indeed a drop in price, followed by a steady increase right afterwards, at 18:55 that is. So whether the system was really predicting this drop or not remains unclear, but it’s definitely surprising to see that manifest!
Above is another interesting version. In this case every prediction is “black” (i.e. red candlestick). I cannot explain why, but it does appear to make a good prediction of the price’s trend between 16:00 and 17:00 nonetheless.
Above is a region where the system did not anticipate a huge drop that is about to come next (at 02:10 or so).
Sometimes there are DNNs that just look weird to say the least (as the one below). Even though they look strange to us, they may contain valuable information that the A.I. system is trying to tell. We just need a better way of interpreting its output.
Conclusion
W
e’ve learned that there are many parameters that influence the shape and value of the predictions. Until now we have not yet figured out which parameters are the best — eventually there will be no definite set of parameters that are “the best”. The reason is that the market is ever changing, so to optimize for maximum profit, we’ll have to continuously change and optimize these all of these parameters as well. That’s one of the reasons why our current auto-predictions system generates multiple forecast graphs as explained in the intro. To validate which parameters are best suited within a certain period (i.e. certain market state), we’ll need a good way to back test the predictions.
The next important matter is how do we correctly use these predictions as an investment model and strategy? How can we use the predictions to generate trading signals (i.e. buy/sell/hold)? These will always remain ongoing questions subject to research, however in the next post I will already reveal some parts of our research.
Prakash M





0 comments:
Post a Comment